01 Probability and Data Design
Day 1-2
- Data Science Lifecycle
- Censuses and Surveys
- Samples
- Non-Random Sampling
- Population, Samples, and Sampling Frame
- Common Biases
- Probability Samples
- Designed Experiment
Data Science Lifecycle
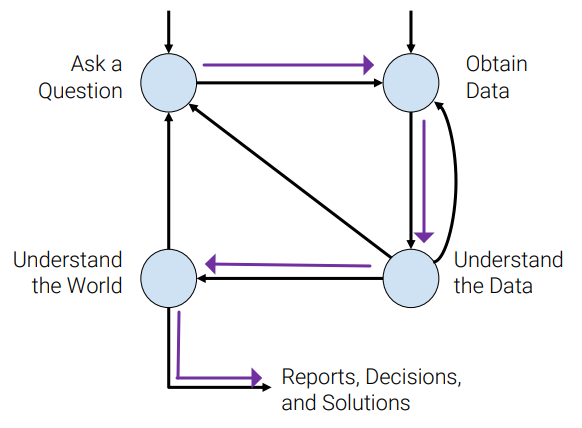
1) Ask a Question (Problem Forumulation)
- What do we **want to know**?
- What **problems** are we trying to solve?
- What are the **hypotheses** we want to test?
- What are our **metrics** for success?
2) Obtain Data (Data Acquisiton and Cleaning)
- What data do we **have** and what data do we **need**?
- How will we sample **more data**?
- Is our data **representative** of the population we want to study?
3) Understand the Data (Exploratory Data Analysis (EDA) & Visualization) ↕️
- How is our data **organized** and what does it contain?
- Do we already have **relevant data**?
- What are the **biases**, **anomalies**, or other **issues** with the data?
- How do we **transform** the data to enable effective analysis?
- usually the **longest process**for data analysts
4) Understand the World (Prediction and Inference: Machine Learning)
- What does the data say about the world?
- Does it answer our questions or accurately solve the problem?
- How robust are our conclusions and can we trust the predictions?
- 5) Reports, Decisions, and Solutions
Censuses and Surveys
| Census | Surveys |
|---|---|
| done periodically, usually led by government and for their purposes (collecting all data) | set of questions |
| ≈ official count / survey of a population, typically recording various details of individuals | what/how is asked affects answers and whether they will answer or not |
- not all census leads to good respondance rate \(\Rightarrow\) should make good survey questions
Samples
Quality, not qunatity!
- Census is great, but 1) EXPENSIVE and 2) DIFFICULT TO CONDUCT
- \(\Rightarrow\)
sample : subset of population- often for inferences about the population
- How to draw sample affects accuracy
- commmon errors
- Chace Error (easy, random sampling): random samples can vary from what is expected, in any direction
- bias (hard, non-random samples): a systematic error in one direction
Non-Random Sampling
CONVENIENCE SAMPLES
- whomever/whatever is convenient for investigators
- bias may occur (unpredictably)
- should not be used in official docs / papers
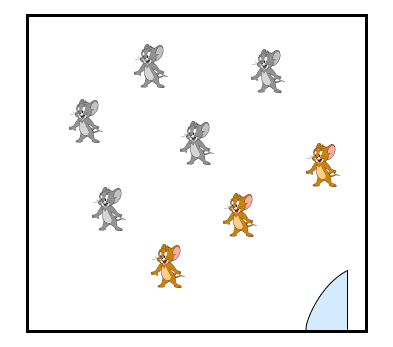
- bias ex) sample ones near the door = mice that are running away
- \(\Rightarrow\) cannot represent total mice population
QUOTA SAMPLES
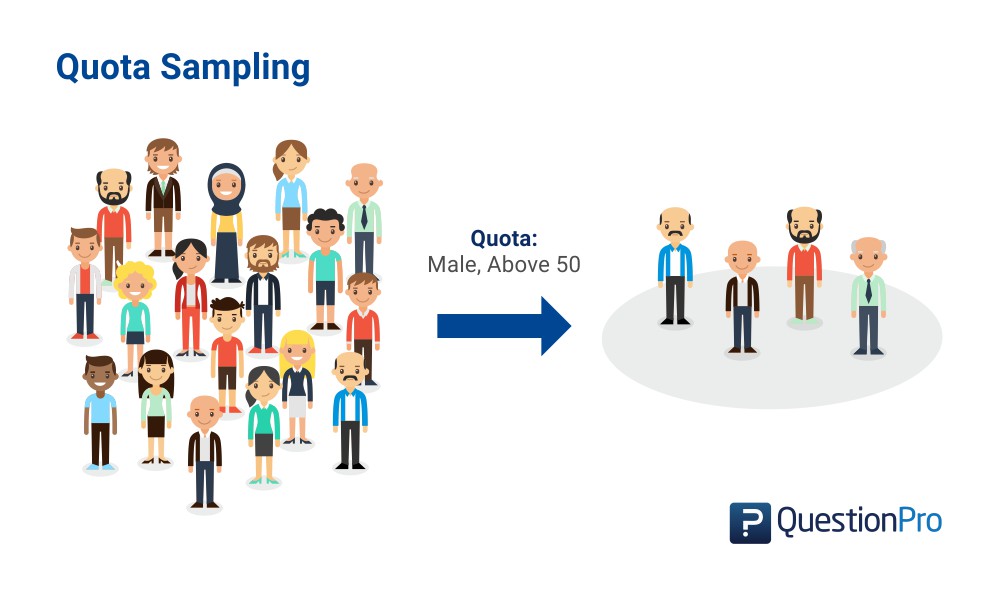
- restricts selection of sample by controlling the number of respondents by one or more criterion
- disadvantages: might be tempted to interview those who look helpful
- biased: not everyone gets ta chance of selection
CASE STUDY Study: 1936 US Presidential Election
- widely used sample
Literary Digest:
- magazine that successfully predicted election outcomes 5 times
- Franklin Roosevelt \(D\) vs Landon \(R\) => predicted Landon’s election
- sent out 10,000,000 surveys to individuals found from
- 1) phone books
- 2) list of magazine subscribers
- 3) list of country club members
- usually the rich people (who used those) went for Landon (\(R\))
- Sample method was biased
- Only 2.4 million people actually filled out survey (24% response rate)
Gallup’s Poll:
- statistician, also made predictions
- successfully predicted with only 50,000 surveys
- knew that Literary Digest would come up with that solutions with that method
- used the same method only on 3000 people and got the same result
| $Roosevelt | #surveyed | |
|---|---|---|
| Literary Digest Poll | 43% | 10,000,000 |
| George Gallup’s Poll | 56% | 50,000 |
| Gallup’s prediction of Digest’s prediction | 44 % | 3,000 |
| Actual Election | 61% | All voters |
\(\Rightarrow\) Big samples aren’t always good, representative matters
- bias will be magnified with larger sample size
Population, Samples, and Sampling Frame
Population : The group that you want to learn sth aboutSampling Frame : list from which the sample is drawn.Sample : actual sampling (subset of sampling frame)
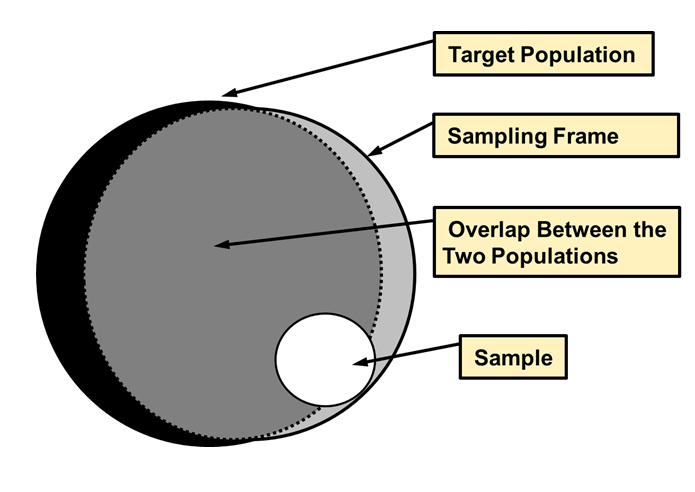
- sampling frame (and sample) may not contain individuals from population
- ideal but not easy: \(population === sampling frame\)
Common Biases
- Selection Bias : systematically excluding/favoring particular groups
- avoid by examining the sampling frame and method of sampling
- Reponse Bias : People don’t always response truthfully
- avoid by examining the nature of questions + method of surveying
- Non-response Bias
- people don’t always respond
- avoid by keeping surveys short & persistent
Probability Samples
- can assign precise prob. to each event drawn
- can quantify uncertainty/confidence about an estimator, prediction, or hypothesis test
standard errors, p-values, or confidence levels are reported without a proper explanation of the sampling procedure \(\Rightarrow\) determine correctness of sampling
- must be able to provide chance that any specified set of individuals will be in the sample
- All individuals in the population do not need to have the same chance of being selected.
- still be able to measure the errors (since all prob. is known)
Simple Random Sample (SRS)
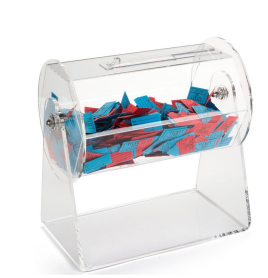
- most widely used sampling
- sample drawn uniformly at random without replacement
ifsample size small (compared to population)then≈ random with replacement
- Number of ways to select an SRS of size \(n\) from population \(N\)
- Chance that a particular element of population is selected by SRS:
MIDTERM
EXAMPLE SCENARIO
- 1200 students lined up alphabetically
- 1 of first 10 students picked randomly
every 10th student picked after that (ex: 2, 12, 22, …)

- Is this a probability Sample?
- YES: if sample is
[n, n + 10, n + 20, ..., n + 1190]where0 <= n <= 10, probability of sample =1/10 - otherwise, probability is 0
- only 10 possible samples
- YES: if sample is
- Does each student have the same probability of being selected?
- YES: each can be chosen with probability of
1/10
- YES: each can be chosen with probability of
- Is this a Simple Random Sample?
- NO : chance of selecting \((8,18)\) =
1/10; - chance of selecting \((8,9)\) =
0
- NO : chance of selecting \((8,18)\) =
- Common Approximation
- common situation: enormous population, but only a small number of sample affordable
- recall that if the population is huge compared to the sample,
- random sampling with replacement ≈ without replaecment
- \(\Rightarrow\) Probabilities of sampling with replacement are much easier to compute!
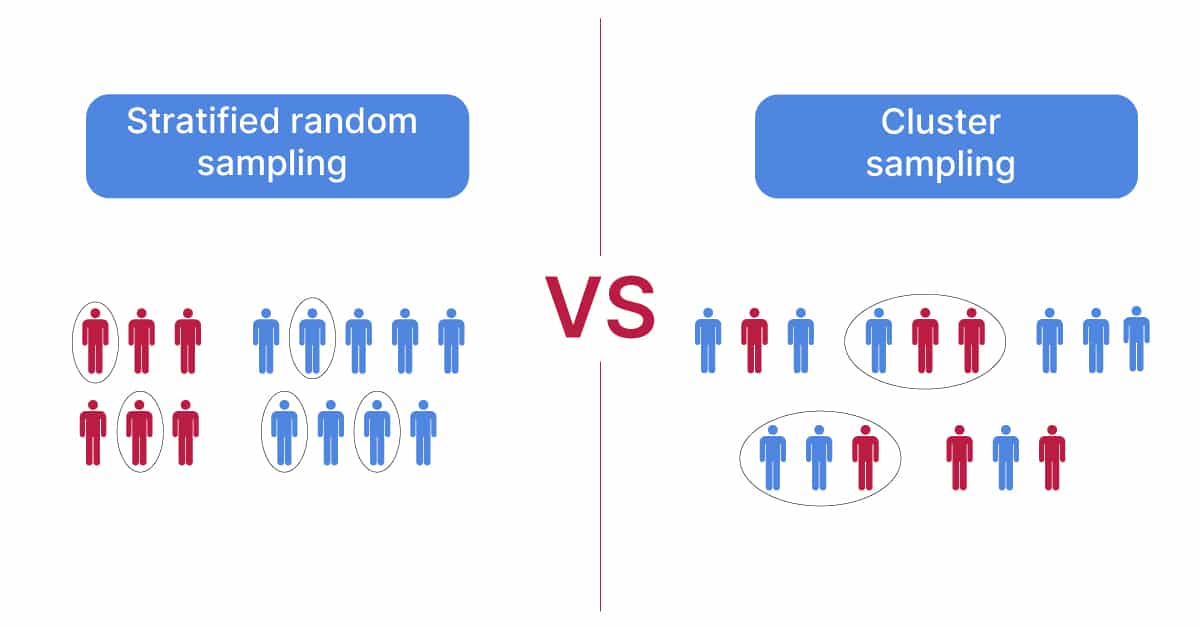
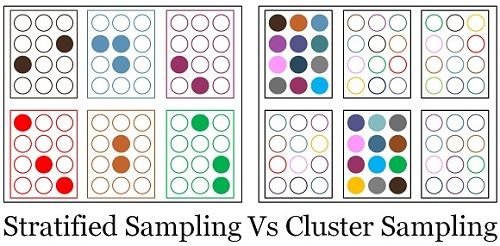
Cluster Sample
- The population is divided into clusters of individuals.
- One then uses SRS to select entire clusters instead of individuals.
- makes data collection easier
- BUT greater variation in estimation \(\Rightarrow\) larger samples than SRS required
Stratified Sample
- The population is divided into strata of individuals, e.g., based on demographics.
- Select SRS of individuals in each stratum.
CLUSTER vs STRATIFIED
MIDTERM + midterm questions
Designed Experiment
- divide groups for examination
- 1) control group
- 2) investigate group
Randomized controlled trial (RCT)
- A type of designed experiment in which participants in the trial are randomly allocated to either (one can end up randomly in either control \(\mid \mid\) investigation group)
- often the gold standard for many types of investigations (ex: clinical trial)
Observational studies
- Examine the association/effect of a treatment on an outcome when the variable of interest is not under the control of the investigator
- E.g. Study effect of smoking on health
A/B Testing
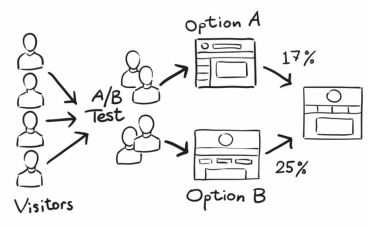
- Determine whether two samples were drawn from the same population, i.e. have the same data generating distribution.
- widely used for marketing, website/mobile app design
- (2000) Google engineers ateempted to find out optimal # of results in serach engine