13 Clustering
in Notes / Dataanalytics / Datascience
- Review: Taxonomy of ML
- K-Means Clustering Algorithm
- Minimizing Inertia
- Agglomerative Clustering
- Picking K
Review: Taxonomy of ML
- Supervised Learning (Labeled Data)
- Regression : Quantitative Response
still mostly used for classification... - Classification : Categorical Response
- Regression : Quantitative Response
-
Unsupervised Learning (Unlabeled Data)
- Dimensionality Reduction
- Clustering
- example: Netflix, Reverse Engineering Biology
K-Means Clustering Algorithm
- most popular clustering approach
- pick arbitrary \(k\), randomly place \(k\) “centers”, each a different color
- repeat until convergence:
- color points according to the closest center
- move center for each color to center of points with that color

- iteration 4 and 5: Centers moved slightly (no points changed color)
iteration 5 and 6 (not shown): no change \(\Rightarrow\) END
- [참고] K-Means \(\neq\) K-Nearest Neighbors
- K-Means: Clustering (assigns each point to one of \(K\) clusters)
- K-Nearest Neighbors: Classification (or Regression)
Minimizing Inertia
K-Means Clustering for \(K=4\) : each run different output
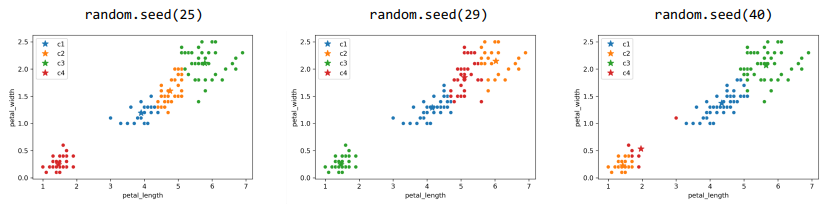
Need Loss Function to determine BEST
Intracluster Distance (distance within a cluster) \(<\) Intercluster Distance (distance between other clusters)
Loss Functions:
-
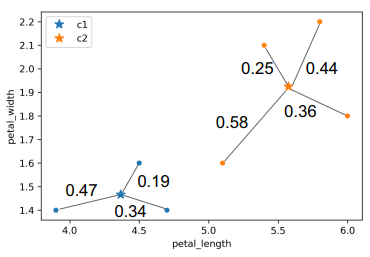
Inertia : Sum of squared distance from each data point to its center
- \(0.47^2 + 0.19^2+0.34^2 + 0.25^2 + 0.58^2 + 0.36^2 + 0.44^2\) \(\)
- lower the better
-
Distortion : weighted Inertia
- \(\frac{0.472 + 0.192 + 0.342}{3} + \frac{0.252 + 0.582 + 0.362 + 0.442}{4}\) \(\)
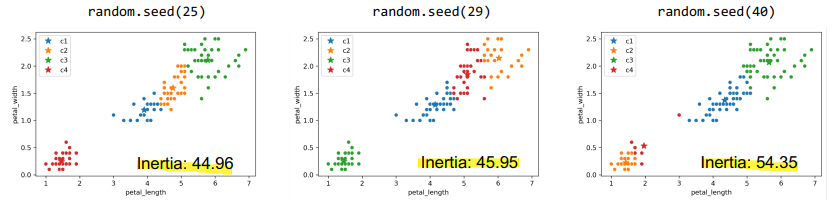
- \(\Rightarrow\) Leftmost (
44.96): BEST, Rightmost (54.35): WORST - K-Means try to minimize inertia but often fails to find global optimum
- K Means: 2개의 optimizer이 번갈아가면서 수행한다고 생각하면 됨
- First optimizer \(\rightarrow\) center position:
hold, data colors: \(optimize\) - Second optimizer \(\rightarrow\) center position: \(optimize\), data colors:
hold
- First optimizer \(\rightarrow\) center position:
- \(\Rightarrow\) neither gets total control: why we iterate
- K Means: 2개의 optimizer이 번갈아가면서 수행한다고 생각하면 됨
- best algorithm so far:
- for all possible \(k^n\) coloring:
- compute \(k\) centers for coloring
- compute inertia for \(k\) centers
ifcurrent_inertiabetter thanbest_known:best_known\(\leftarrow\)current_inertia
- for all possible \(k^n\) coloring:
- \(\Rightarrow\) 안쓰는 이유: \(k^n\) too big to compute
- inertia will only show local instead of global
- no better algorithm found K-Means = NP-hard
Agglomerative Clustering
- aka hierarchical clustering
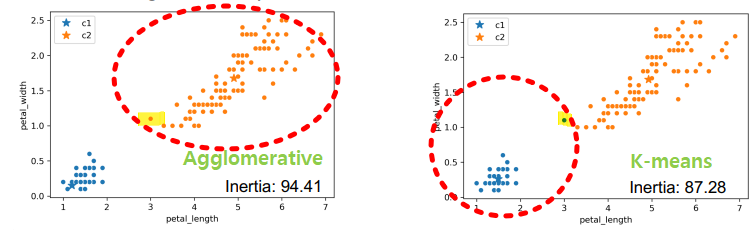
- K-Means: minimize inertia
- result not guaranteed to optimize inertia
- global optimum 마저 직관적이지 않을 수 있음
- Aggolomerative Clustering:
- every data point starts out as its own cluster
- Join clusters with neighbors until \(K\) cluster remains
- Example: \(K=2\)
- note: x-axis & y-axis scale different
common choice when comparing distances \(\Rightarrow\)
max distance - Why it’s also called hierarchical clustering:
- able to keep track of merge (each cluster=tree)
- dendrogram: (\(K=2\))
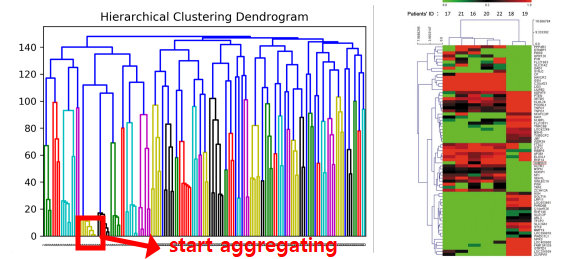
- More clustering Algorithms
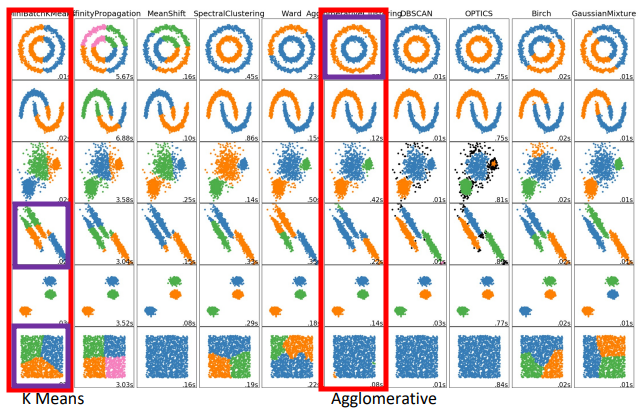
- 때에 따라 적절히 사용해야 함 (purple: better)
Picking K
- Intuitively
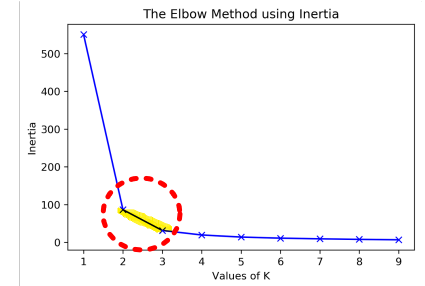
- PICK: Elbow Method
- plot inertia versus many different \(K\) values
- pick \(K\) in elbow (하지만 데이터가 복잡하면 elbow없는 경우 다수)
- EVALUATE: Silhouette Scores
- check how “well clustered”
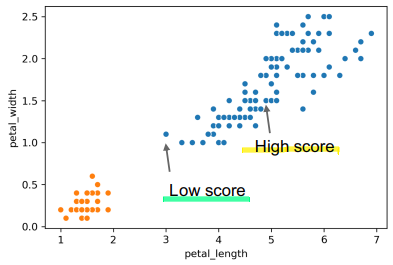
- High Score: near the other points in X’s cluster
- Low Score: Far from other points in cluster
- for data point \(X\), score \(S\):
- \(A\): avg distance to other points in cluster (intra)
- \(B\): avg distance to points in closest cluster (inter)
- \(S=\frac{B-A}{max(A,B)}\) - Observations:
- highest possible \(S\) = 1 (all points in \(X\)’s cluster on top of \(X\))
- \(S\) can be negative when \(X\)’s avg distance within cluster \(>\) avg distance to nearby cluster (\(A > B\))
- ex: Low Score on graph has \(S=-0.13\)
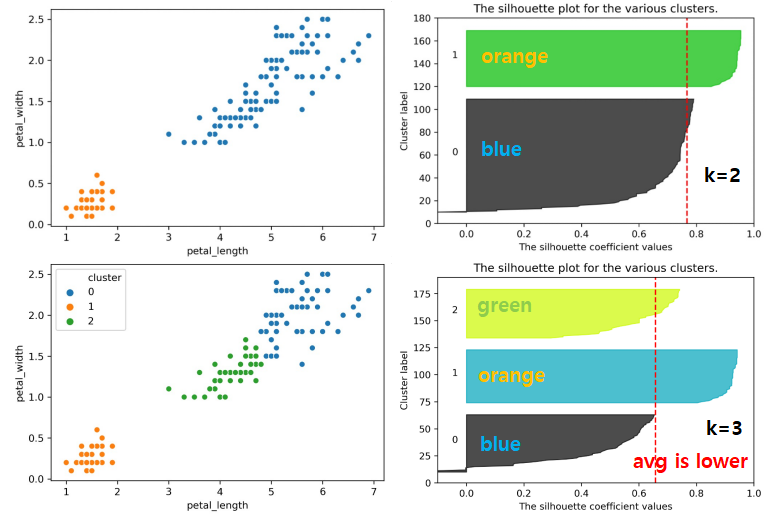
- points with large silhouette widths = deeply inside cluster
- Real World Metrics
- Perform 2 clusterings, for example:
- cluster heights & weights of customers with \(K=3\) to design
[ S, M, L ]t-shirts - cluster heights & weights of customers with \(K=5\) to design
[ XS, S, M, L, XL ]shirts
- Out of 2 different \(K\)s, pick one that maximizes profit