02 Pandas
Pandas I + II
- Data Structures
- Indexing with the [ ] Operator
- Boolean Array Selection and Querying
- Indexing with .loc and .iloc
- Handy Properties and Utility Functions
- Adding, Modifying, and Removing Columns
- _groupby .agg
Data Structures
Data Structures in picture
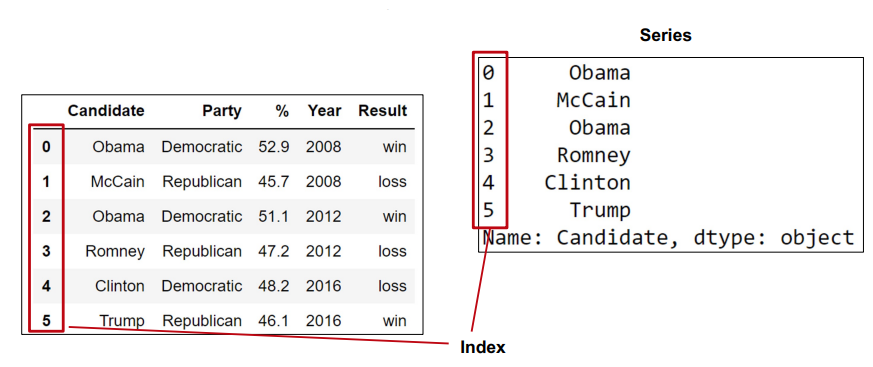
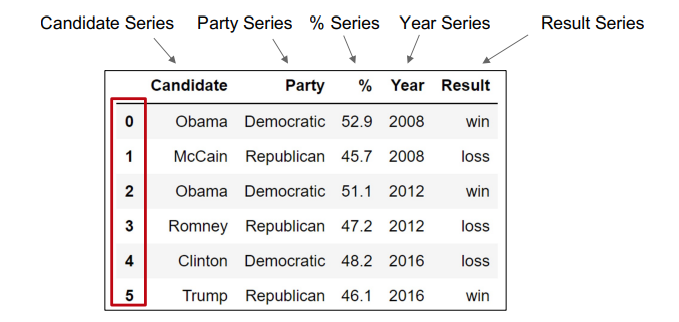
- Data Frame: 2D tabular data (collection of series)
- Series: 1D data (columnar data)
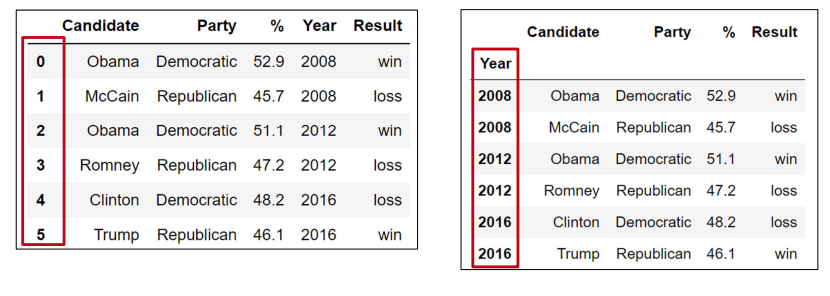
- Index: A sequence of row labels
- can be non-numeric, can have a name (nonunique)
- column names almost always unique
Indexing with the [ ] Operator
- Our dataframe:
elections
| Candidate | Party | % | Year | Result | |
|---|---|---|---|---|---|
| 0 | Obama | Democratic | 52.9 | 2008 | win |
| 1 | McCain | Republican | 45.7 | 2008 | loss |
| 2 | Obama | Democratic | 51.1 | 2012 | win |
| 3 | Romney | Republican | 47.2 | 2012 | loss |
| 4 | Clinton | Democratic | 48.2 | 2016 | loss |
| 5 | Trump | Republican | 46.1 | 2016 | win |
- indexing by column names
column name argument
elections['Candidate'].head(6): series0 Obama 1 McCain 2 Obama 3 Romney 4 Clinton 5 Trump Name: Candidate, dtype: objectlist argument (even one argument)
elections[["Candidate", "Party"]].head(6): DF# Candidate Party 0 Obama Democratic 1 McCain Republican 2 Obama Democratic 3 Romney Republican 4 Clinton Democratic 5 Trump Republican - indexing by row slices
use row numbers
elections[0:3]: DFCandidate Party % year Result 0 Obama Democratic 52.9 2008 win 1 McCain Republican 45.7 2008 loss 2 Obama Democratic 51.1 2012 win - [참고]:
elections[0]\(\rightarrow\) error (requires slicing!)elections[0:]\(\rightarrow\) all dataframeelections[0:1]\(\rightarrow\) 1 line of df
- [참고]:
Example Question:
weird = pd.DataFrame({1:['topdog', 'botdog'], "1":['topcat', 'botcat']})wierd:1 1 0 topdog topcat 1 botdog botcat
weird[1]0 topdog 1 botdog Name: 1, dtype: objectweird["1"]0 topcat 1 botcat Name: 1, dtype: objectweird[1:]1 1 1 botdog botcat
Boolean Array Selection and Querying
Boolean Array
elections[[True, False, True, False, False, False]](`True` on index 0 and 2)Candidate Party % year Result 0 Obama Democratic 52.9 2008 win 2 Obama Democratic 51.1 2012 win Boolean Array using Logical Operators
elections[elections['Party']=='Democratic']Candidate Party % year Result 0 Obama Democratic 52.9 2008 win 2 Obama Democratic 51.1 2012 win 4 Clinton Democratic 48.2 2016 loss - [참고]
elections['Party']=='Democratic':
0 True 1 False 2 True 3 False 4 True 5 False Name: Party, dtype: bool // 대충 1D array of True and False- [참고]
Boolean Series combined by & Operator
elections[(elections['Result']=='win') & (elections['%']<50)]Candidate Party % year Result 5 Trump Repulican 46.1 2016 win - [참고]
(elections['Result']=='win'),(elections['%']<50):
0 True 0 False 1 False 1 False 2 True 2 False 3 False 3 True 4 False 4 True 5 True 5 True Name: Party, dtype: bool Name: Party, dtype: bool- [참고]
_isin function
- makes it more convenient & neat to find rows that match one of many
elections[ (elections['Party']=='Democratic') | (elections['Party'] =='Republican') ]
# == is equal to
elections[elections['Party'].isin(['Republican', 'Democratic'])] # better
Query Command
elections.query( "Result=='win' and year < 2010" )
| Candidate | Party | % | year | Result | |
|---|---|---|---|---|---|
| 0 | Obama | Democratic | 52.9 | 2008 | win |
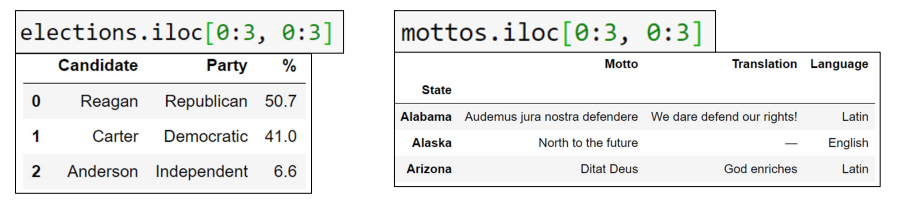
Indexing with .loc and .iloc
locandiloc: alternatives to index into DFloc : location based indexing iloc: integer-based indexing
_loc
- access values by labels
- access values using boolean array
Most basic: provide list of row and col labels \(\Rightarrow\) DF
elections.loc[ [0,1,2,3,4], ['Candidate', 'Party'] ]Candidate Party 0 Obama Democratic 1 McCain Republican 2 Obama Democratic 3 Romney Republican 4 Clinton Democratic - when row label is not a number (index)
elections.loc[ [ 1980, 1984 ], ['Candidate', 'Party'] ]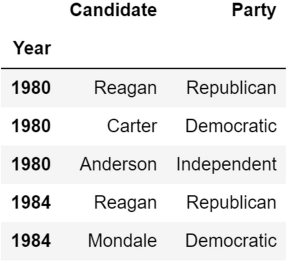
loc with slices
- BTW: slicing works with all label types
- Slicing with loc are inclusive, not exclusive
elections.loc[ 0:4 , 'Candidate':'Party' ]Candidate Party 0 Obama Democratic 1 McCain Republican 2 Obama Democratic 3 Romney Republican 4 Clinton Democratic elections.loc[ 1980:1984 , 'Candidate':'Party' ]would also work.
- single label as column argument \(\Rightarrow\) Series
elections.loc[ 0:4, 'Candidate' ]0 Obama 1 McCain 2 Obama 3 Romney 4 Clinton Name: Candidate, dtype: object - single column argument in a list \(\Rightarrow\) DataFrame
elections.loc[ 0:4, ['Candidate'] ]Candidate 0 Obama 1 McCain 2 Obama 3 Romney 4 Clinton - single label as row argument \(\Rightarrow\) Series
elections.loc[ 0, 'Candidate':'Party' ]Candidate Obama Party Democratic Name: 0, dtype: object</div></details> - single row argument in a list \(\Rightarrow\) DataFrame
elections.loc[ 0:4, ['Candidate'] ]Candidate Party 0 Obama Democratic locsupportsBoolean Arrayselections.loc[(elections['Result']=='win') & (elections['%']<50), 'Candidate':'%' ]Candidate Party % 5 Trump Republican 46.1 - [참고]
(elections['Result']=='win'),(elections['%']<50):
0 False 1 False 2 False 3 False 4 False 5 True dtype: bool- [참고]
_iloc
- doesn’t think about labels at all
returns items that appear in the
numberical positions specified - even tho the row name is a string (not index)
- even tho the row name is a string (not index)
- advantages of loc:
- harder to make mistakes
- easier to read
- not vulnerable to changes to the ordering of rows/cols in raw data files
- still, iloc can be more convenient \(\Rightarrow\) use iloc judiciously
Handy Properties and Utility Functions
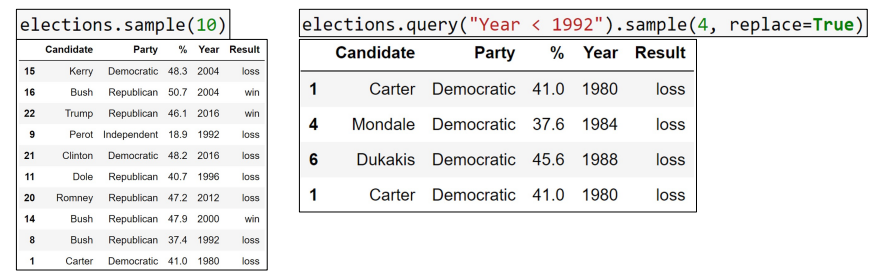
_sample
- DF of random selection of rows
- default : without replacement (but
replace=Trueallowed) - can be chained with selection operators
[],loc,iloc
_numpy opeartions
np.mean( winners )max( winners )
descriptions
head: displays only the top few rows (5 by default) (df.head(4))size: gives total number of data points (df.size: 30 )shape: gives size of data in r x c (df.shape: (6, 5))describe: provide summary of dataindex: Returns the index (aka row labels)RangeIndex(start=0, stop=6, step=1)
columns: returns labels for the columnsIndex(['Candidate', 'Party', '%', 'year', 'Result'], dtype='object')
sort
sort_values: sort dataframe according to a specific columnelections.sort_values('%', ascending=False)Candidate Party % Year Result 0 Obama Democratic 52.9 2008 win 2 Obama Democratic 51.1 2012 win 4 Clinton Democratic 48.2 2016 loss 3 Romney Republican 47.2 2012 loss 5 Trump Republican 46.1 2016 win 1 McCain Republican 45.7 2008 loss sort_valueson serieselections['Candidate'].sort_values().head(5)4 Clinton 1 McCain 0 Obama 2 Obama 3 Romney Name: Candidate, dtype: object
values
value_counts: creates new Series showing counts of every valueelections['Party'].value_counts()Democratic 3 Republican 3 Name: Party, dtype: int64elections.value_counts()Candidate Party % year Result Clinton Democratic 48.2 2016 loss 1 McCain Republican 45.7 2008 loss 1 Obama Democratic 51.1 2012 win 1 52.9 2008 win 1 Romney Republican 47.2 2012 loss 1 Trump Republican 46.1 2016 win 1 dtype: int64
_unique
- must be done at series; returns numpy array
elections['Party'].unique()array(['Democratic', 'Republican'], dtype=object)elections.unique()\(\Rightarrow\) AttributeError
_str
- manipulating string data
Scenario: Find all rows where name ends with n
Approach #1: Use
list comprehnesions create a list of booleans where i-th entry == True if i-th name startswith J
elections.loc[0, 'Candidate'].endswith('n')
> False

ends_with_n = [x.endswith('n') for x in elections['Candidate']]
ends_with_n
> [False, True, False, False, True, False]

result = elections[[x.endswith('n') for x in elections['Candidate']]]
result:
Candidate Party % Year Result 1 McCain Republican 45.7 2008 loss 4 Clinton Democratic 48.2 2016 loss
pass this list to
[]orloc[]
Approach #2: use
strresult = elections[elections['Candidate'].str.endswith('n')]- \(\Rightarrow\) more readable & efficient
- approach #1 is not idiomatic (관용적)
str.function_nameworks on 1-D array (series) and returns series of boolean- if you want to change 1D series to Dataframe, use
.to_frame()
- if you want to change 1D series to Dataframe, use
str.startswith('')str.contains('')str.split('o')0 [Obama] 1 [McCain] 2 [Obama] 3 [R, mney] 4 [Clint, n] 5 [Trump] Name: Candidate, dtype: object
Adding, Modifying, and Removing Columns
- Scenario: Sort names by length.
sort_valuesdoes not provide custom comparisonApproach #1: Create
temp column and sort # create new series of length candidate_names = elections['Candidate'].str.len() # add that series to dataframe as a column elections['name_length'] = candidate_nameselections.sort_values('name_length')Candidate Party % Year Result name_length 0 Obama Democratic 52.9 2008 win 5 2 Obama Democratic 51.1 2012 win 5 5 Trump Republican 46.1 2016 win 5 1 McCain Republican 45.7 2008 loss 6 3 Romney Republican 47.2 2012 loss 6 4 Clinton Democratic 48.2 2016 loss 7 - since we just made a new column (modified original
electionsdf) drop that temp column# axis refers to dropping column (df drops row by default) elections = elections.drop('name_length', axis = 1) sub-scenario: sort by # of occurences of \(a\) and \(m\)
- sort by Arbitrary Functions :
Series.map
def count_a_m(name):
  return name.count('a')+name.count('m')

elections['countA_M'] = elections['Candidate'].map(count_a_m)
elections.sort_values(by='countA_M', ascending=False)Candidate Party % Year Result countA_M 0 Obama Democratic 52.9 2008 win 3 2 Obama Democratic 51.1 2012 win 3 1 McCain Republican 45.7 2008 loss 1 3 Romney Republican 47.2 2012 loss 1 5 Trump Republican 46.1 2016 win 1 4 Clinton Democratic 48.2 2016 loss 0 - sort by Arbitrary Functions :
- since we just made a new column (modified original
- Approach #2: Create
sorted index + use loc- Create Series of only lengths of names
name_length = elections['Candidate'].str.len() - Sort series of only name lengths
name_length = name_length.sort_values() - Pass sorted index as argument of
.locto original DFindexOf_name_length = name_length.index indexOf_name_length > Int64Index([0, 2, 5, 1, 3, 4], dtype='int64') elections.loc[indexOf_name_length]
- Create Series of only lengths of names
_groupby .agg
example data: baby names inlcuding states
- too many lines, so
babies = babies[babies['Year']>2000](only the names after 2001) babies.head()Id Name Year Gender State Count 10737 10737 Madison 2001 F AK 54 10738 10738 Emily 2001 F AK 47 10739 10739 Hannah 2001 F AK 46 10740 10740 Ashley 2001 F AK 40 10741 10741 Abigail 2001 F AK 39 Scenario: Find the names that have changed the most in popularity
- keep it simple and use absolute max/min difference (max(count)-min(count))
- ex) $$Jennifer$’s abs max/min diff = 2026 - 5 = 2021
def ammd(series):
  return max(series)-min(series)

jennifer_counts = babies.query("Name == 'Jennifer'")["Count"]
> 10893      6
  11063      7
  11450      8
  11873      8
  12121      7
            ..
  5585891    8
  5587162    6
  5632370    8
  5632465    9
  5632632    6
  Name: Count, Length: 647, dtype: int64

ammd(jennifer_counts)
> 2021
Approach #1: Getting
AMMD for every name - use python knowledge
ammd_of_babyname_counts = {} for name in sorted(babies['Name'].unique()): counts_of_current_name = babies[babies['Name']==name]['Count'] ammd_of_babyname_counts[name] = ammd(counts_of_current_name) ammd_of_babyname_counts = pd.Series(ammd_of_babyname_counts)- extremely slow and complicated
Approach #2: Using
groupby.aggbabies.groupby('Name').agg(ammd)simpler, faster, more versatile
ammd_of_babyname_counts.head()Id Name Year Name Aaban 2069 1 0 Aadan 4369373 6 2 Aadarsh 0 0 0 Aaden 5470653 9 153 Aadhav 0 0 0 … … … … Zyra 4379713 6 3 Zyrah 4380163 2 1 Zyren 0 0 0 Zyria 3680790 13 2 Zyriah 3698873 8 5