07 Learning Problem
in Notes / Dataanalytics / Datascience
Introduction
- The big picture of Machine Learning (Learning from Data)
Problem Setup
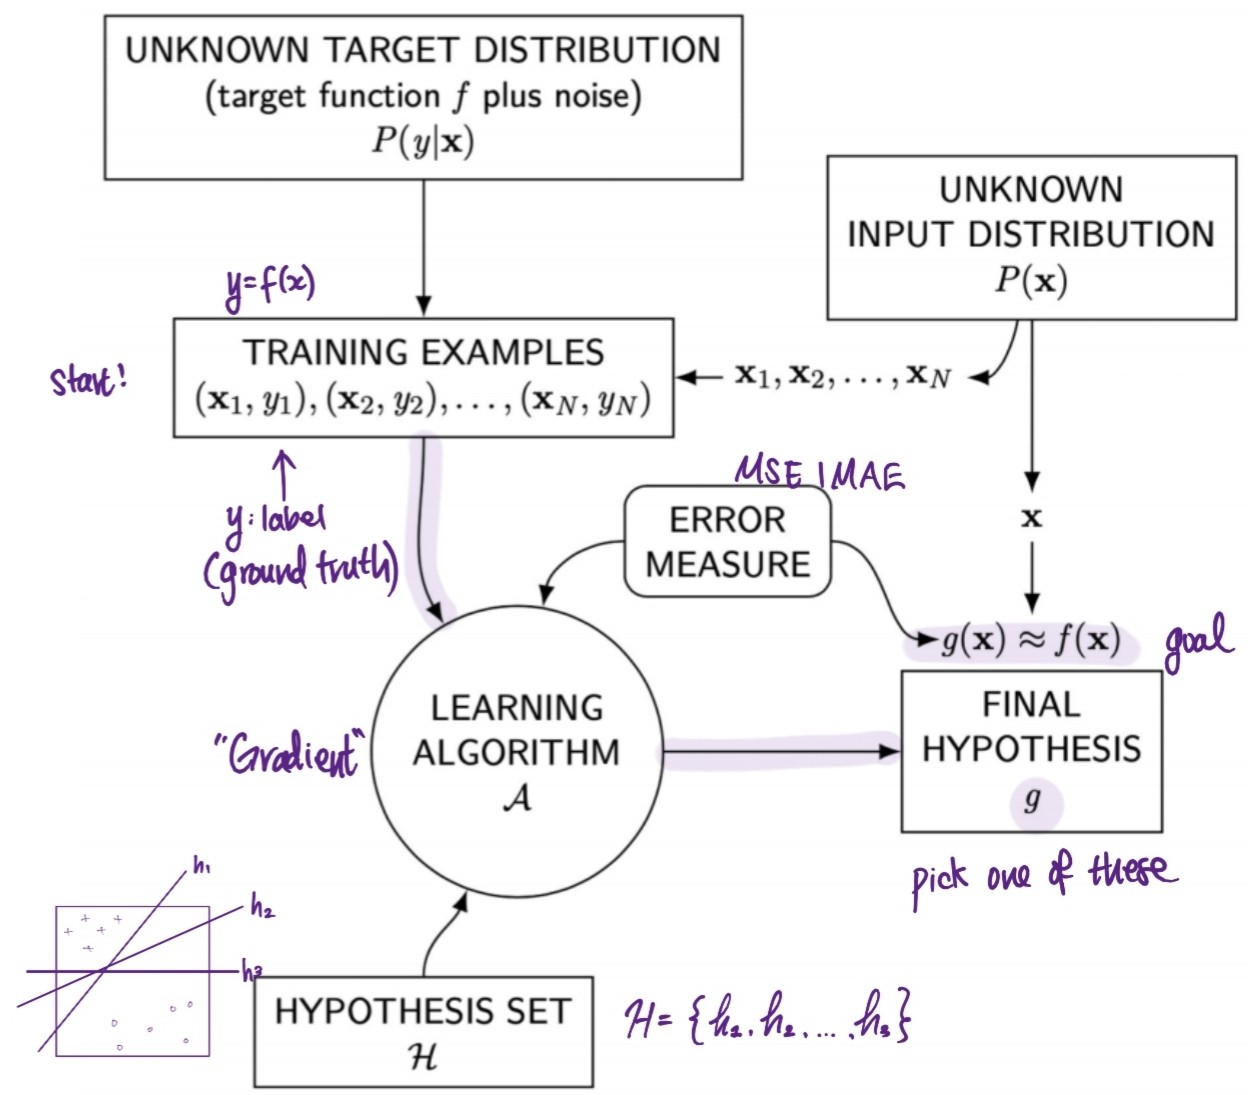
Formalization:
- \(X = ℝ^d\) : input space
- \(ℝ^d\): d-dimensional Euclidean space
- input vector \(x ∈ X : x = (x_1, x_2, ..., x_d)\)
- let \(y={+1, -1}\) : output space (\(\rightarrow\) binary decision)
- \(X = ℝ^d\) : input space
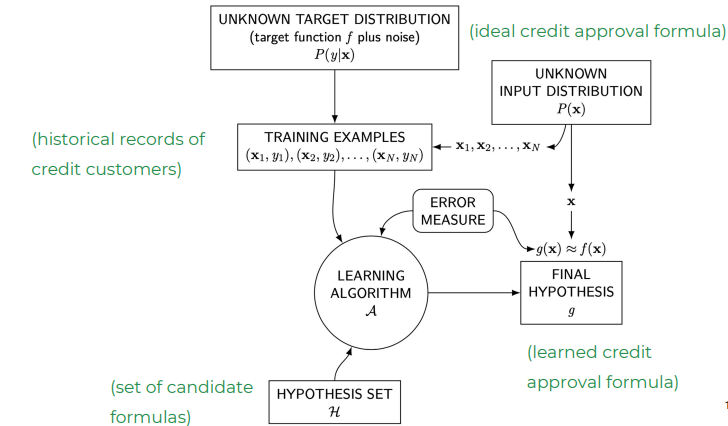
Example: credit approval (P/F) of applicants of bank loan
component symbol credit approval metaphor input \(x\) customer application output \(y\) approve / deny target function \(f : X \rightarrow Y\) ideal credit approval formula data \((x_1, y_1), ..., (x_N, y_N)\) historical records hypothesis \(g: X \rightarrow Y\) formula to be used - \(f\): unkown target function
- \(X\): input space (set of all possible inputs \(x\))
- \(Y\): output space (set of all possible outputs)
- \(N\): the number of input-output examples ( training examples )
\(D≜ {(x_1, y_1), ..., (x_N, y_N)}\): data set where \(y_n = f(x_n)\)
- find \(g(x) \approx y=f(x)\)
- Example:
- \(x = \begin{bmatrix} x_1\\x_2\end{bmatrix}\) where \(x_1\): age and \(x_2\): annual salary (in USD)
- \(N=\) 11, \(d=\) 2, \(X= ℝ^2\), and \(Y=\) {
approve,deny} - data set \(D\):
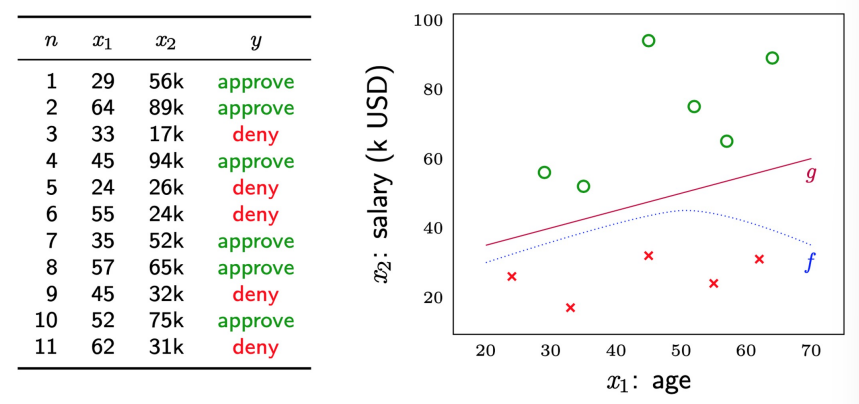
- \(\Rightarrow\) linear model (easy, but might not be accurate) \(\rightarrow\) find \(g\) close to \(f\)
Learning Algorithms \(A\):
- use \(D\) to pick a formula \(g : X \rightarrow Y\) that approximates \(f\)
- choose \(g\) from set of candidate formula under consideration, which we call hyothesis set \(H\)
- ex) \(H\) = set of all linear formulas \(\rightarrow\) choose best linear fit to \(D\) from this
- Scenario Example: new customer applies for credit \(\rightarrow\) bank makes decision
- based on learned \(g\), not on \(f\) (unknown)
if\(g\) faithfully replicates \(f\) \(\rightarrow\) decision is reasonable (good)
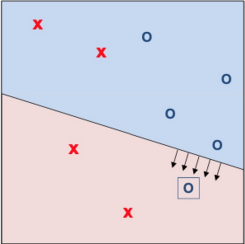
Visualized
A simple Learning Model
- Solution Components
- give a specific learning problem
- target function \(f\) (unknown)
- training examples
- learning algorithm, hypothesis set
- Learning Model = \(Learning\) \(Algorithm\) + \(Hypothesis\) \(Set\)
- give a specific learning problem
- Hypothesis Set \(H\):
- \(H\) specified through \(h(x)\) (\(h ∈ H\))
- functional form \(h(x)\):
- gives different weights to different coordinates of \(x\)
- reflects their relative importance in the credit decision
- in this example: \(h(x)\) =linear model
- \(H\): set of lines
Perceptron
Making a Decision:
- weighted coordinates combined to form a ‘credit score’
- resulting score compared to threshold
- The ‘perceptron’ (using linear model)
- \(h(x)\) = \(sign((\sum_{i=1}^dw_ix_i)-threshold)\)
- = \(sign((\sum_{i=1}^dw_ix_i)+b)\)
// b = bias- \(sign(s)= \begin{cases} +1, s>0\\-1, ㄴ<0\end{cases}\) (
s=0 ignored for now) must find decision boundary
- \(sign(s)= \begin{cases} +1, s>0\\-1, ㄴ<0\end{cases}\) (
- \(h(x)\) = \(sign(w^Tx)\)
simplified version of linear model- different values for parameters \(w_1, w_2, b\)
- correspond to different lines \(w_1x_1 + w_2x_2+b=0\)
- for
simplification: treat bias \(b\) as weight \(w_0 \equiv b\) - introduce artificial coordinate \(x_0=1\)
- \(w_1x_1 + w_2x_2+w_0x_0 \Rightarrow\) \(w^Tx \Rightarrow \sum_{i=0}^d w_ix_i\)
- Roles of Learning Algorithm
- search \(H\) by looking for weights and bias that perform well on dataset
- produce final hypothesis \(g \in H\)
PLA
Perceptron Learning Algorithm
iterative, guaranteed to converge for linearly seperable
- GOAL: determine optimal w based on the data to produce
ASSUME: data set is linearly seperable
Steps (continued from Perceptron)
- perceptron implements \(h(x) \equiv sign(w^Tx)\), given training set
(x1, y1), ..., (xN, yN) - PLA picks
misclassified point- \(sign(w^Tx_n)\) \(\neq y_n\)
- \(\rightarrow\) updates weight vector \(w \leftarrow w^Tx_n\)
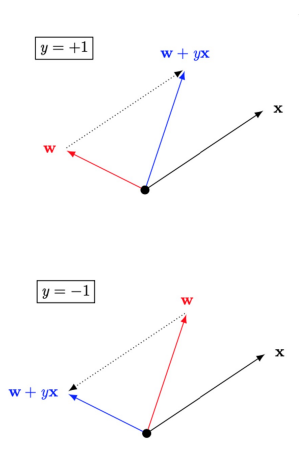
- \(\Rightarrow\) rule moves
boundaryin the direction of classifying \(x_n\) correctly
- iterate until no misclassified data
- iteration
t = 1, 2, ...pick a misclassified point from(x1, y1), ..., (xN, yN)and run PLA iteration on it - \(w(t+1)\) \(\leftarrow w(t) + y_nx_n\)
- iteration
- perceptron implements \(h(x) \equiv sign(w^Tx)\), given training set
Example
  You want to predict if movies will be profitable based on their screenplays.
  You hire two critics A and B to read a script you have
  and rate it on a scale 1 to 4.
  The critics are not perfect. Here is the data:
  ---------------------------------------
   #  Movie Name    A     B     Profit?
  ---------------------------------------
   1  Pellet Power  1     1       -
   2  Ghosts!       3     2       +
   3  Pac is Bac    2     4       +
   4  Not a Pizza   3     4       +
   5  Endless Maze  2     3       -
  ---------------------------------------
- First, you want to check the linear separability of data. Plot the data on the 2D plane above, label movies with \(+\) and \(-\) and determine.
Answer
| + + | - | + | - ㅡㅡㅡㅡㅡㅡ- \(\Rightarrow\)
Linearly Seperable
- \(\Rightarrow\)
- Now decide to use a perceptron to classify you data. Suppose you directly use scores given above as features, together with a bias feature. That is \(f_0 = 1, f_1 =\) score given by A, \(f_2 =\) score given by B
- Run one pass through data with perceptron algorithm, filling out the table below. Go through the data points in order (using data point #1 at step
1)
| step | Weights | Score | Correct? |
|---|---|---|---|
| 1 | [ -1, 0, 0 ] | \((-1 \cdot 1) + (0 \cdot 1) + (0 \cdot 1) = -1\) | yes |
| 2 | |||
| 3 | |||
| 4 | |||
| 5 |
Answer
- first x ($$x_0$$) = always 1 (artifical coordinate introduced)

| step |   Weights    |                       Score                       | Correct? |
| :--: | :----------: | :-----------------------------------------------: | :------: |
|  1   | [ -1, 0, 0 ] | $$(-1 \cdot 1) + (0 \cdot 1) + (0 \cdot 1) = -1$$ |   yes    |
|  2   | [ -1, 0, 0 ] | $$(-1 \cdot 1) + (0 \cdot 3) + (0 \cdot 2) = -1$$ |  ***no***  |
|  3   | <cb>[  0, 3, 2 ]</cb> | $$( 0 \cdot 1) + (3 \cdot 2) + (2 \cdot 4) = 14$$ |   yes    |
|  4   | [  0, 3, 2 ] | $$( 0 \cdot 1) + (0 \cdot 3) + (0 \cdot 4) = 17$$ |   yes    |
|  5   | [  0, 3, 2 ] | $$( 0 \cdot 1) + (0 \cdot 2) + (0 \cdot 3) = 12$$ |  ***no***  |
- change weight when
incorrect - after
step 2: weight ([ -1, 0, 0 ]) @ (dot product)+ ([ 1, 3, 2 ]) =[ 0, 3, 2 ] - after
step 5: weight ([ 1, 3, 2 ]) @ (dot product)- ([ 1, 2, 3 ]) =[ 0, 1, -1 ]
- after
- \(\Rightarrow\) final weights =
[-1, 1, -1]
- Have weights been learned that separate the data?
Answer
- $$No$$
- with weights `[-1, 1, -1]`, data `point 3` (−1 · 1 + 1 · 2 + −1 · 4 = −3 < 0 ) and `point 4` (−1 · 1 + 1 · 3 + −1 · 4 = −2 < 0 ) will be incorrect
  - step 2's 0 will be counted as positive
- Choose scenarios for which a perceptron using the features above can indeed perfectly handle a range of scenarios.
- (a) Your reviewers are awesome: if the total of their scores is more than 8, then the movie will definitely be profitable, and otherwise it won’t be.
- (b) Your reviewers are art critics. Your movie will be profitable if and only if each reviewer gives either a score of 2 or a score of 3
- (c) Your reviewers are art critics. Your movie will be profitable if and only if each reviewer gives either a score of 2 or a score of 3
Answer
- (a) : can classify (considering weights `[-8, 1, 1]`)
- (b), (c): can't classify