03 Data Cleaning and EDA
in Notes / Dataanalytics / Datascience
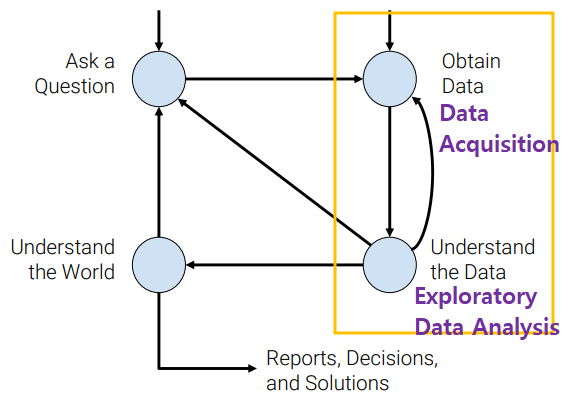
Data Cleaning ⇔ EDA
- infinite loop of data science
Data Cleaning
- transforming
raw data to facilitate subsequent analysis - often addresses
issues: - structure / formatting (
re) - missing or corrupted values (
na,null) - unit conversion
- encoding text as numbers …etc
- structure / formatting (
Exploratory Data Analysis (EDA)
Getting to \(know\) the data
- key of Data Science
-
transforming, visualizing, summarizing data in order to:
- build / confirm understanding of the data and its provenance
- identify / address potential issues in data (\(\rightarrow\) domain knowledge required)
- inform the subsequent analysis
- discover potential hypothesis (becareful)
- open-ended analysis (be willing to find sth surprising)
Key Data Properties of EDA
Structure
the shape of the data file
RECTANGULAR DATA
preferable
- easy to manipulate & analyze
- big part of data cleaning: transforming data to be more rectangular
Types of rectanglar data:
- Tables (
dataframes,relations)- names columns with different types
- manipulated using data transformation langauges (
map,filter,group by,join…)
- Matrices
- numeric data of the same type
- manipulated using linear algebra
- Tables (
DATA FILES
- Tabular data
- \(TSV\): Tab seperated values
- \(CSV\): Comma seperated values
- common!
- issues: how to deal with commas, tabs in records & quoting
- \(JSON\): JavaScript Object Notation
- widely used file format for nested data
- similart to python dictionaries
- issues:
- not rectangular
- each record can have different fields
- record can contain tables \(\rightarrow\) complicated
\(XML\) : Extensible Markup Language
- nested data
example
<catalog> <plant type="a"> <common>Bloodroot</common> <botanical>Sanguinaria canadensis</botanical> <zone>4</zone> <light>Mostly Shady</light> <price>2.44</price> <availability>03/15/2006</availability> <description> <color>white</color> <petals>true</petals> </description> <indoor>true</indoor> </plant> … </catalog>- \(Log Data\)
example
169.237.46.168 - - [26/Jan/2014:10:47:58 -0800] "GET
/stat141/Winter04 HTTP/1.1" 301 328
"http://anson.ucdavis.edu/courses/" "Mozilla/4.0 (compatible; MSIE
6.0; Windows NT 5.0; .NET CLR 1.1.4322)”
169.237.6.168 - - [8/Jan/2014:10:47:58 -0800] "GET /stat141/Winter04/ HTTP/1.1" 200 2585 "http://anson.ucdavis.edu/courses/" "Mozilla/4.0 (compatible; MSIE 6.0; Windows NT 5.0; .NET CLR 1.1.4322)"
KEYS AND JOINS
- useful when referencing other pieces of data
- Primary Key: column / set of columns that determine the values of remaining columns
- unique (usually
ID)
- unique (usually
- Foreign Key: column (set of columns) that reference primary keys in other tables
joinrequired
Questions to ask about STRUCTURE:
- 데이터 사용 전 체크리스트!
- Are the data in standard format or encoding:
- Tabular Data: CSV, TSV, Excel, SQL
- Nested Data: JSON, XML
- Are the data organized in ‘records’?
if no: can we define records by parsing data?
- Are the data nested?
if yes: can we reasonably un-nest the data?
- Does the data reference other data?
if yes: can we join/merge data?
- What are the fields in each records?
- How are they encoded? (ex: strings, numbers, binary, dates, …)
- What is the
typeof the data?
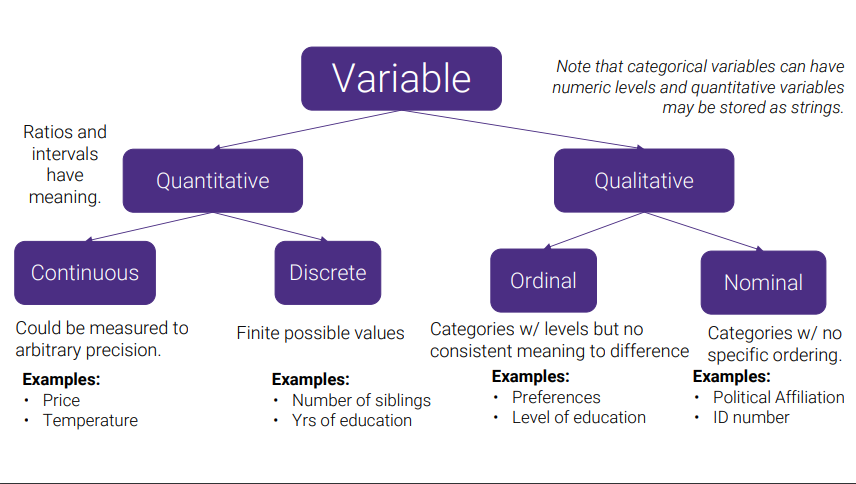
Variable Types
- Quantitative : Ratios and intervals have meaning
- Continuous: Could be measured to arbitrary percision (ex: price, temperature)
- Discrete: Finite possible values (ex: # of siblings, Yrs of education)
- Qualitative
- Ordinal: Categories w/ levels but no consistent meaning to difference (ex: preferences, level of education) (ordered)
- Nominal: Categories w/ not specific ordering (ex: political affiliation, ID #) (non-ordered)
| (Qual) Continuous | (Qaul) Discrete | (Quant) Ordinal | (Quant) Nominal | |
|---|---|---|---|---|
| \(CO_2level\) (PPM) | O | |||
| # of Siblings | O | |||
| GPA | O | |||
| Income bracket (low, mid, high) | O | |||
| Race | O | |||
| # of years of education | O | |||
| Yeb Rating (?) | O |
Granularity (세분성)
how fine/coarse is each datum
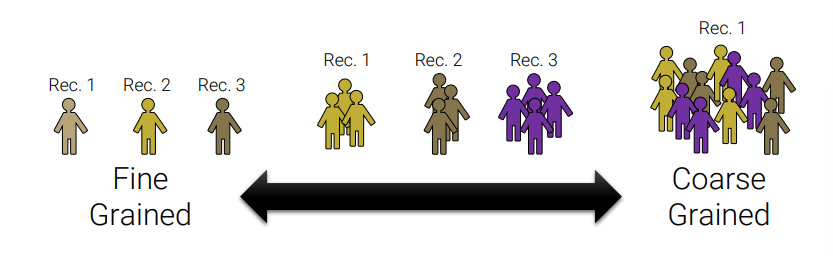
- What does each record represent?
- ex: a purchase, as person, a group of users
- do all records capture granularity at the same level?
- some data will include summaries (aka rollups) as records
- if the data are coarse how was it aggregated?
- sampling, averaging…etc
Scope
how (in)complete is the data
- (big enough) Does my data cover my area of interest?
- ex: studying Crimes in Korea but only having Seoul crime data
- (small enough) Is my data too big?
- ex: interested in student grades for COSE471 but have all CS classes grades
- Filtering \(\Rightarrow\) Implications on sample?
if data==sample: may have poor coverage after filtering
Does my data cover the right time frame? (related to temporality)
-
Sampling Frame : population from which the data was sampled
- sampling frame
!=population of interest
Revisiting Sampling Frame
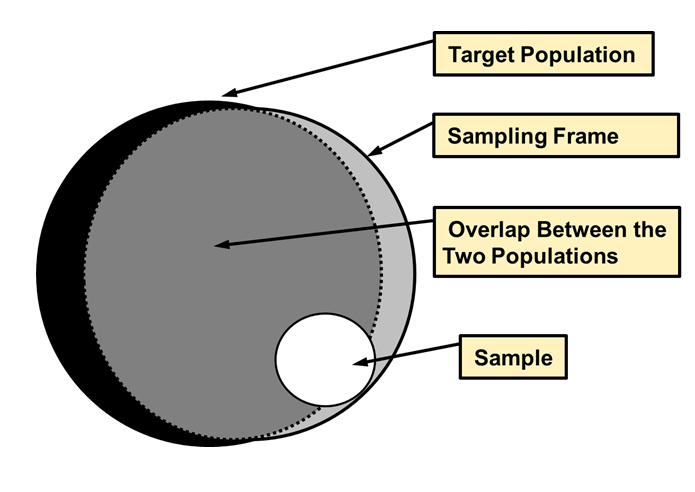
- How complete/incomplete is the frame (and its data)?
- How is the frame/data situated in place?
- How well does the frame/data capture reality?
- How is the frame/data situated in time?
- sampling frame
Temporality
how is the data situated in time
-
Data changes - when was the data collected?
- What’s the meaing of time and date fields? (1, 2, or 3?)
- When the event happened
- When the data was collected or entered into system
- When the data was copied into a database (look for many matching timestamps)
- Where does the time depend on? (Time zones & daylight savings)
- Learn to use
datetimepython library
- Learn to use
Faithfulness
how well does the data capture “reality” \(\mid\) Do I trust the data?
Checklists
- does my data contain unrealistic or “incorrect” values?
- dates in the future for events in the past
- non-existing locations
- negative counts
- misspellings of names
- large outliers
- does my data violate obvious dependencies?
- age !== birthday
- was the data entered by hand?
- spelling errors, field shifted
- forms require fields or provide default values?
- are there obvious signs of Data falsification?
- repeated names, fake looking email addresses, repeateud use of uncommon names/fields
- Missing Values/Default Values
" ",0,-1, 999, 12345,NaN, Null,1970, 1900
Solutions on Missing Values
- Drop records with missing values
- ≈ most common
- Caution: check for biases introduced by dropped values
- Imputation (inferring missing values)
- Mean Imputation: replace with an average value (often use closest related subgroup mean)
- Hot deck imputation: replace with a random value
- choose a random value from the subgroup and use it for the missing value
- Suggestion
- drop missing values but check for induced bias (use domain knowledge)
- directly model missing values during future analysis
MISSING_VALUE_TOKEN: let model learn this in the future
Solutions on other Faith Issues
- Truncated data (early excel limits: 65536 Rows, 255 Columns)
- \(\Rightarrow\) be aware of consequences in analysis (how did truncation affect sample?)
- Time Zone Inconsistencies
- \(\Rightarrow\) convert to a common timezone (ex:
UTC) - \(\Rightarrow\) convert to the timezone of the location - useful in modeling behavior
- \(\Rightarrow\) convert to a common timezone (ex:
- Duplicated Records or Fields
- \(\Rightarrow\) identify + eliminate (use primary keys) => implications on sample?
- Spelling Errors
- \(\Rightarrow\) Apply corrections \(\mid\) Do drop records not in dictionary
- Units not specified or consistent
- \(\Rightarrow\) infer units, check values are in reasonable ranges for data
Summary
- examine data and metadata
- what is the date, size, organization, and structure of the data?
- examine each field / attribute / dimension individually
- examine pairs of related dimensions
- stratifying earlier analysis: break down grades by major
- along the way:
- visualize/summarize the data
- validate assumptions about data and collection process
- identify and address anomalies
- apply data transformation and corrections
- Record everything you do!